Back

Sport Scope

2024

Pitstop Podcast Sports Scope Stream
Pitstop Podcast Sports Scope
P1 Podcast Notification
Sports Scoppe Soccer  Comparison
Sports Scope Football Match

Case Study

Sport Scope

A sports broadcasting app that

aggregates and compares diverse fan opinions for varied perspectives.

P1 Podcast Sports Scope
Sports Scope App Home Screen

Timeline

September 2024 - November 2024

(8 Weeks)

Roles

Product Discovery, UX Research, Usability

Testing, Measuring Metrics

Impact

  • Highest mark in the cohort.

  • 45% increase in product findability.

Overview

Bias is sports boadcasting

As part of my class, I embarked on an individual UX project focused on redefining the user experience in sports broadcasting. The challenge was bridging the disconnect between traditional, mainstream commentary and sports fans' passionate, diverse voices.


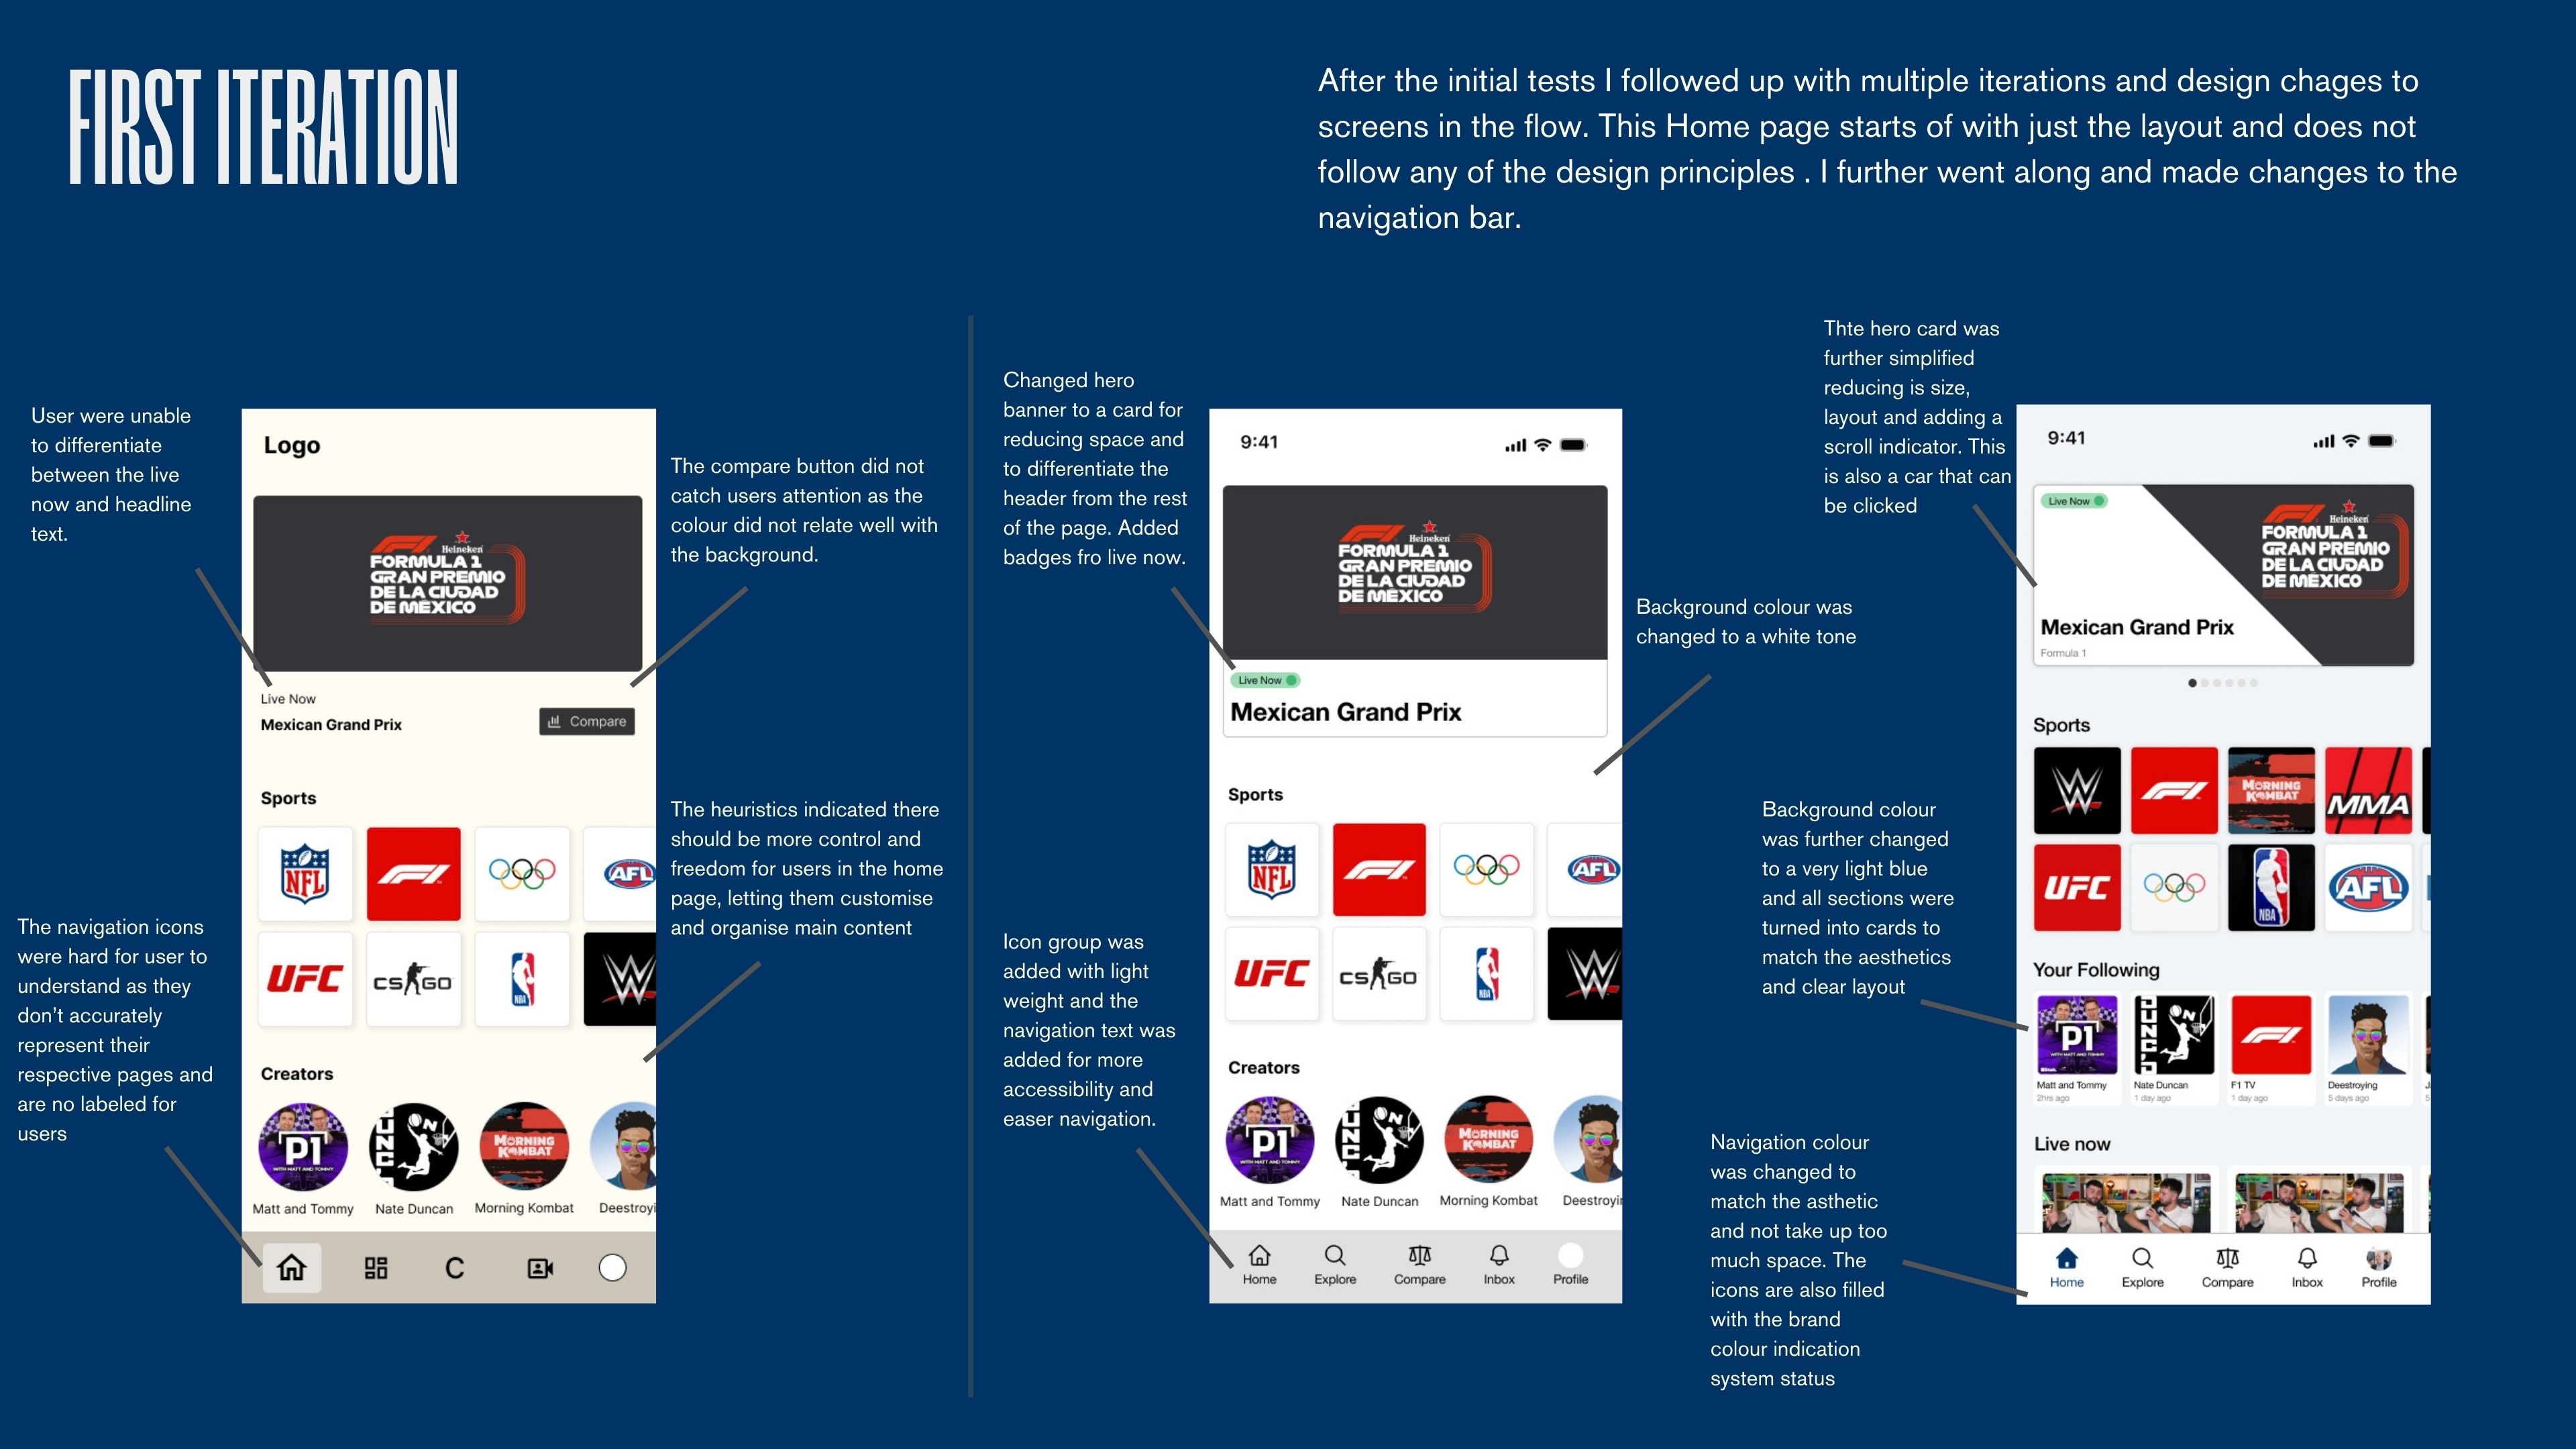
Through iterative design processes, I developed Sport Scope, a platform integrating tools, and curated fan-driven content to enhance transparency and user engagement.


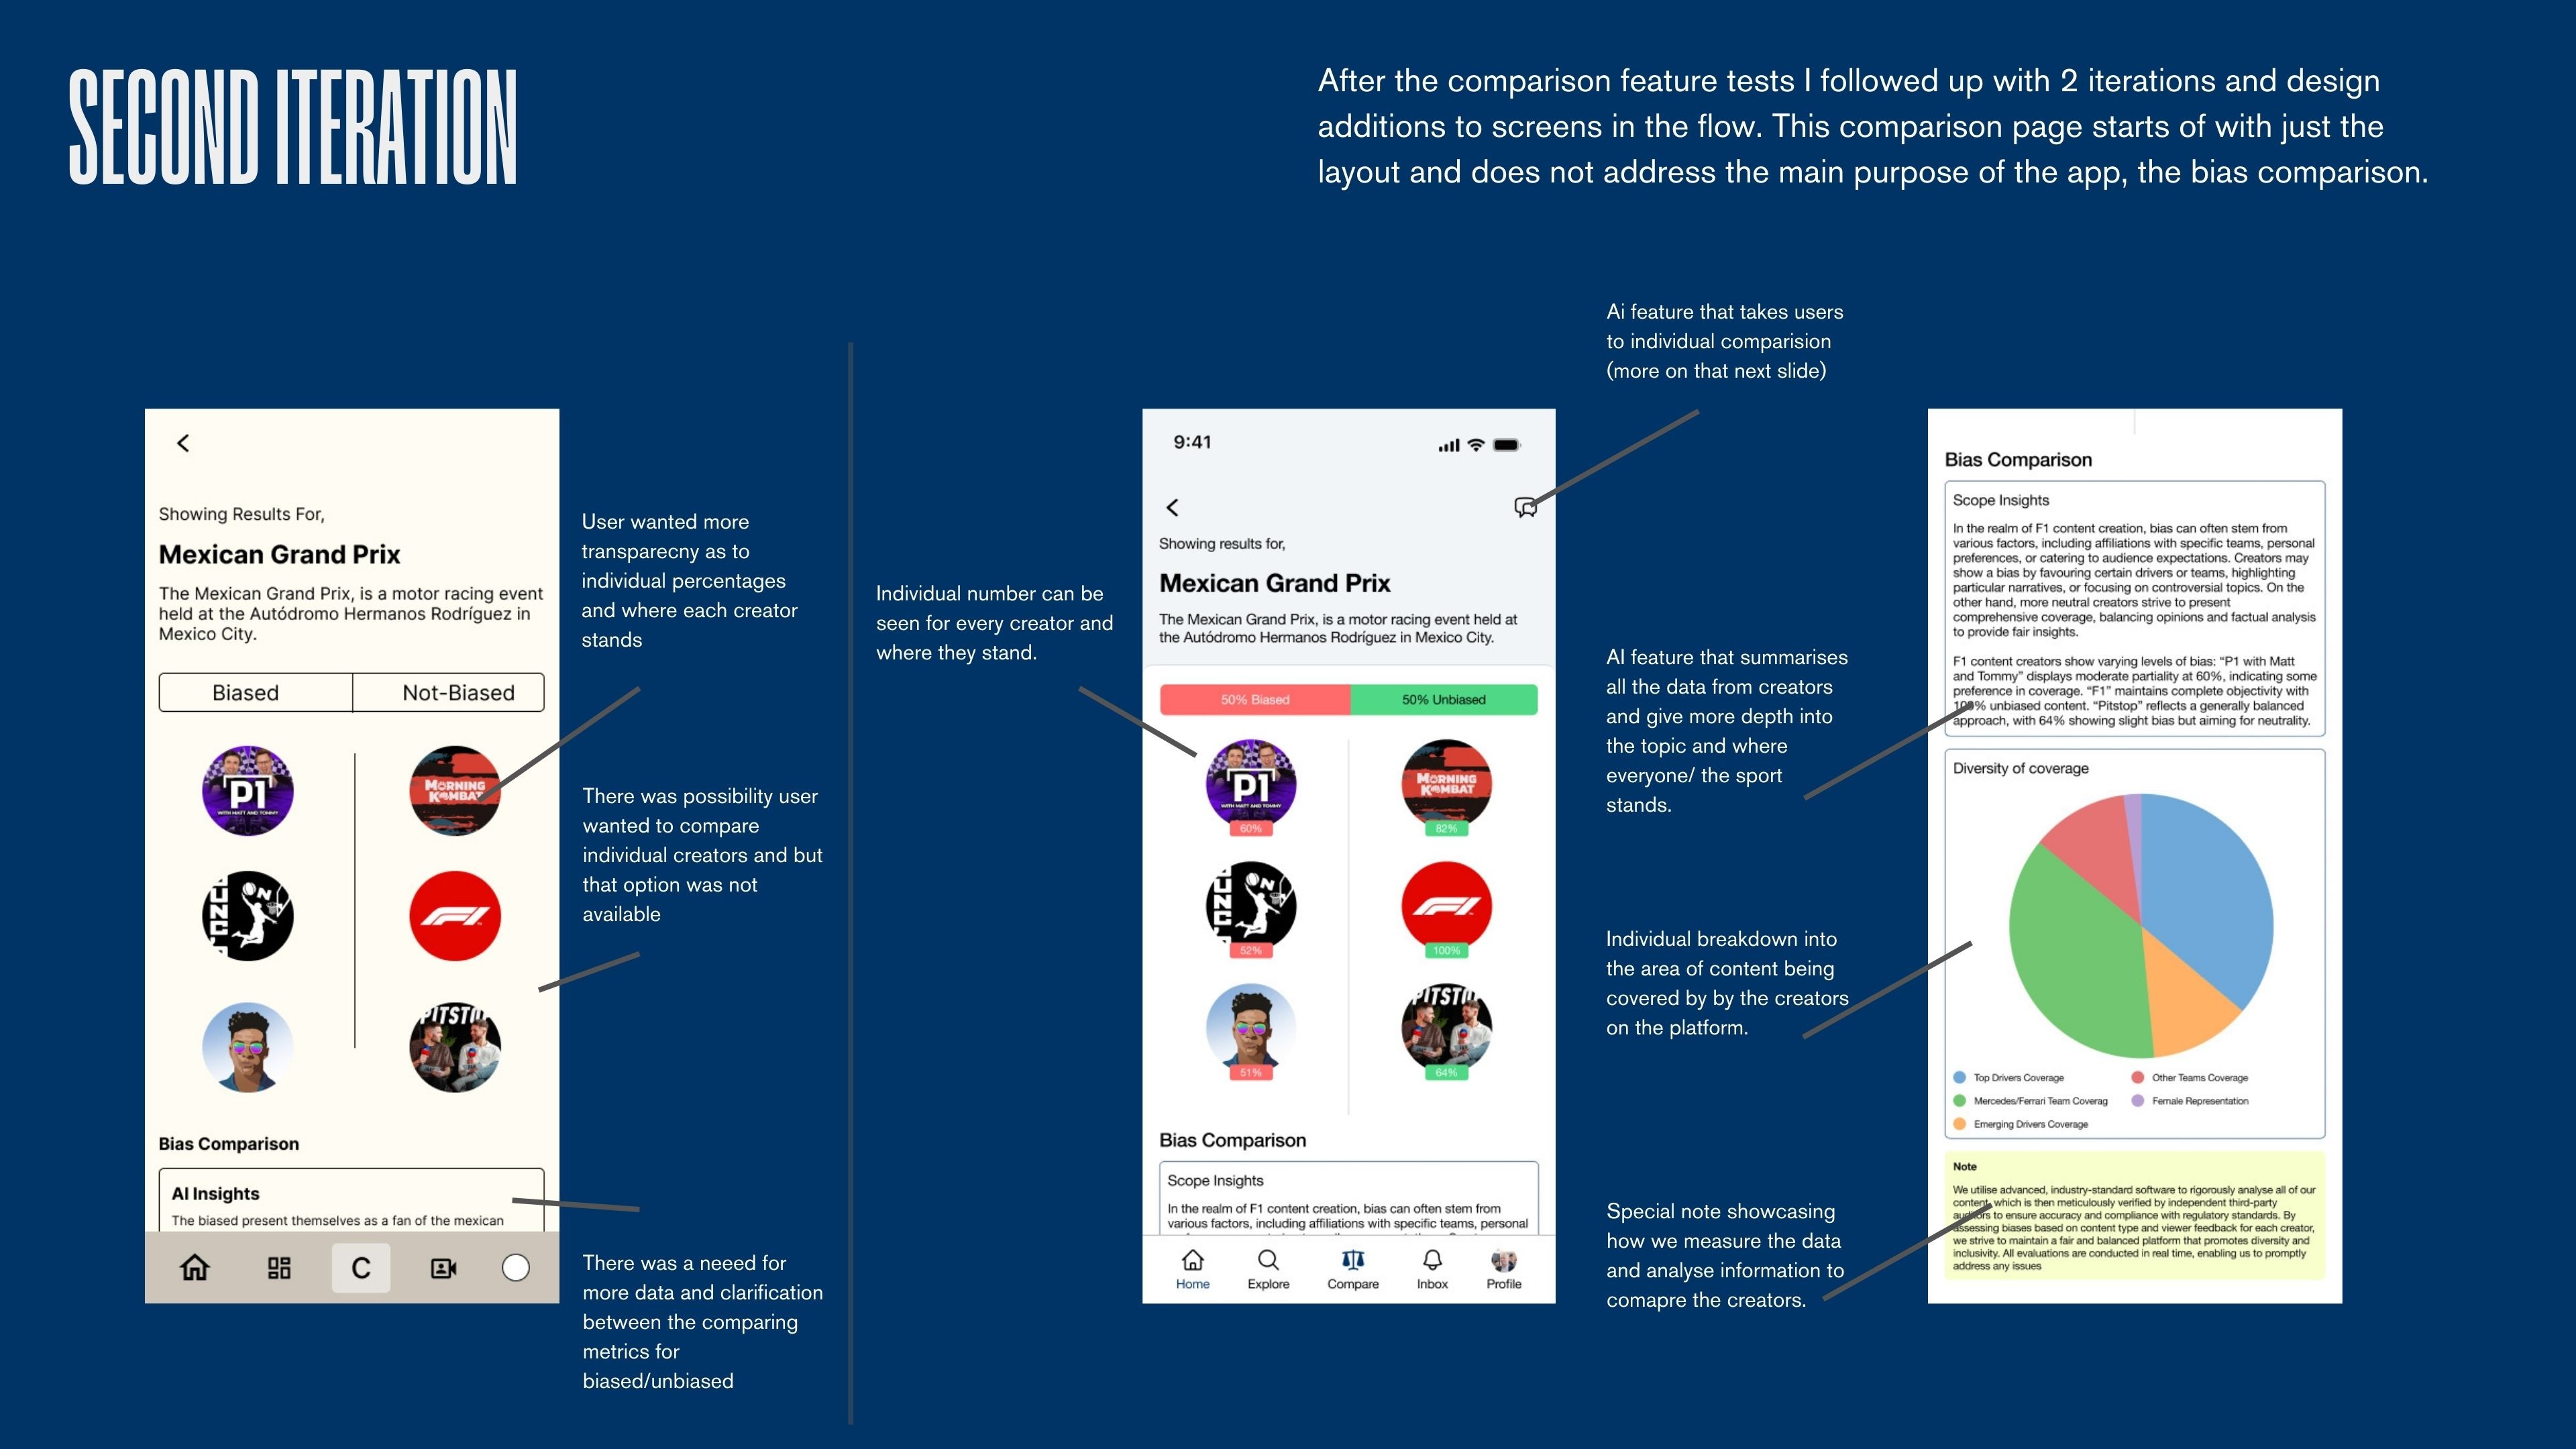
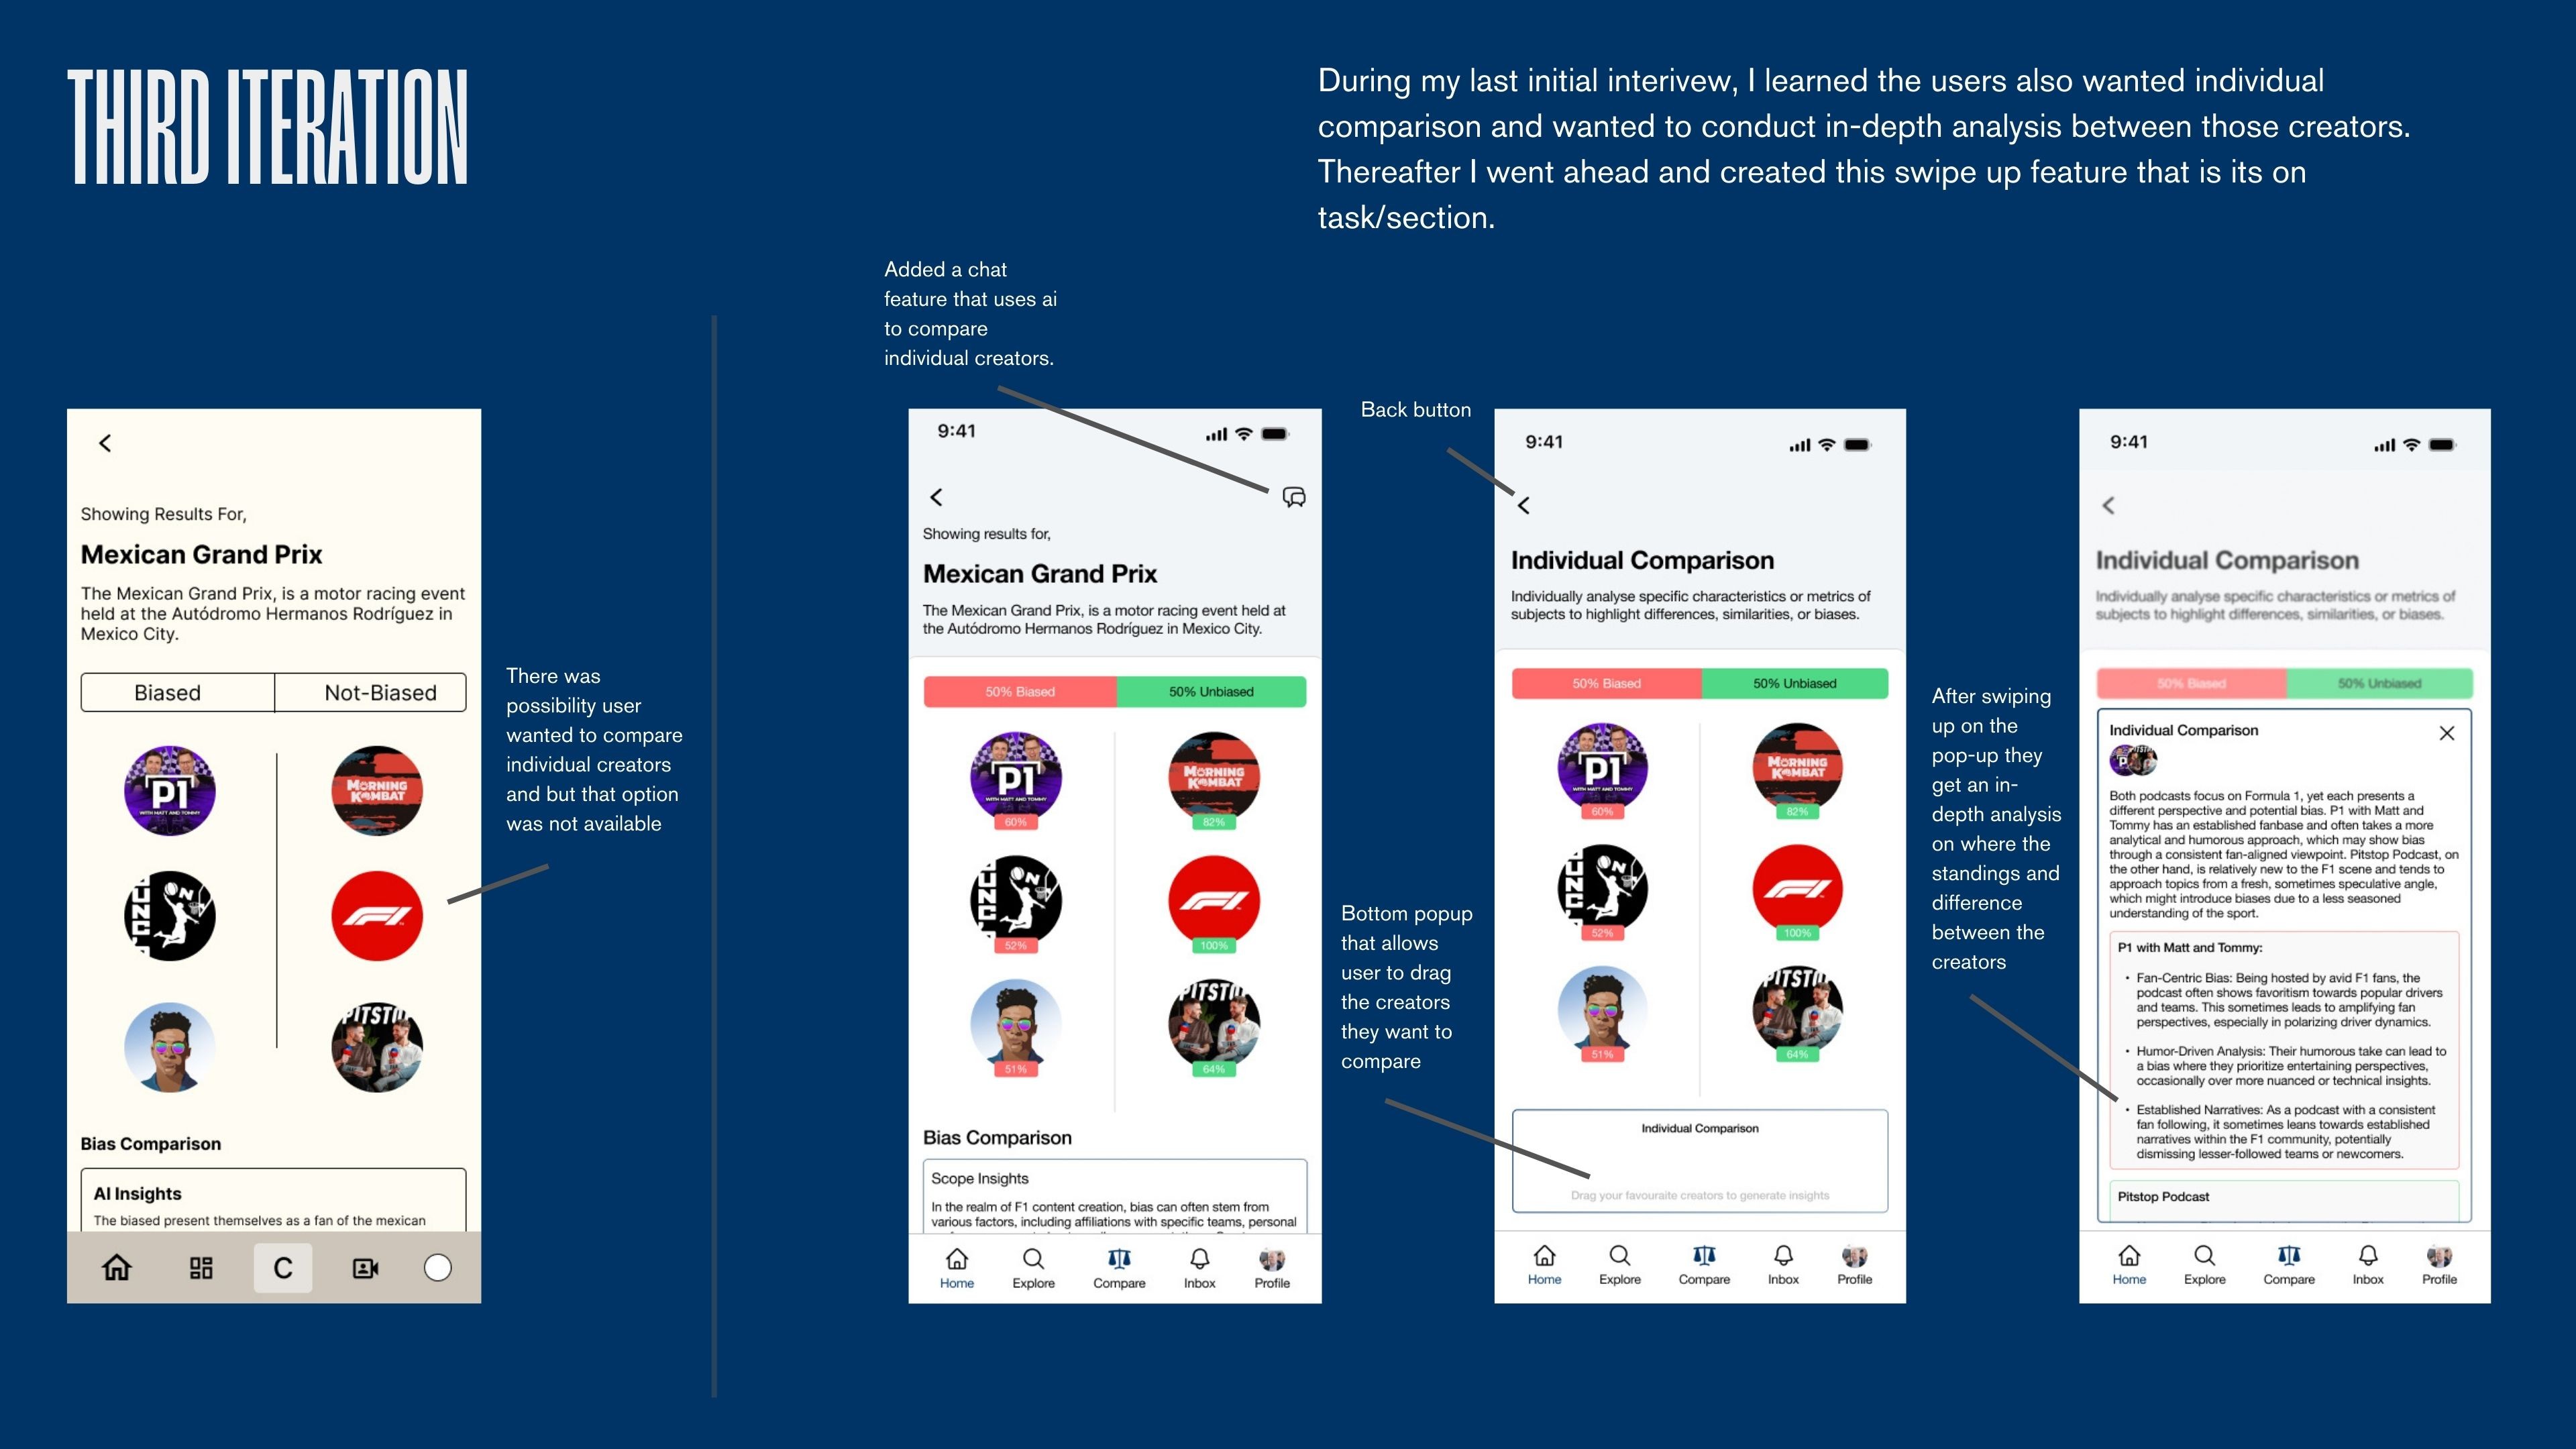
I identified key pain points—such as the difficulty in comparing content creator biases and navigating diverse opinions—and refined the design to address these challenges. The project culminated in receiving the highest mark in the class, demonstrating the transformative potential of user-centred design in sports media.

35% increase in user satisfaction

Upon usability testing and feedback, satisfaction with the

Bias Meter feature significantly improved.

30% increase in user engagement

Enhanced UI and interaction design led to a higher

engagement rate with the comparison tools.

Sports Scope Prodcut DEMO

Problem

Problem

Problem

Traditional sports media has long been dominated by the same polished, mainstream voices—seasoned commentators offering well-rehearsed narratives.


While this approach appeals to some, it often leaves fans craving something more authentic, diverse, and relatable. The stories that matter—the underdog moments, the untold struggles of athletes, the passionate, real-time reactions from the stands—are frequently overshadowed by commercialized, one-size-fits-all commentary.


In an era dominated by social media, fans have taken matters into their own hands. For sports updates:

Sources

Use Facebook

Turn to YouTube

Flock to Instagram

Fans rely on social media for live game updates

But even with this surge in fan-driven commentary, many face challenges:

  1. How do you find the voices that resonate with your perspective?

  1. How do you know which commentators share your bias—or challenge it?

  1. Why is it so hard to compare different viewpoints in one place?

Sports fans want more than just highlights—they crave stories that

reflect their passion, their frustrations, and their triumphs.

Solution

Solution

Solution

For the first time, fans take full reins on what, where, when, and how they watch sports content via sports scope

Sports Scope App Features

Primary Research

Primary Research

Primary Research

After undergoing secondary research showcasing the rise of sports leagues like the NBA, fans were allowed to live view creator streams and interact with them. I conducted Quantitative and Qualitative research methods primarily focusing on data-driven insights and decisions. I used the triangulation research framework, Content Analysis, Surveys, and Semi-structured Interviews.


The questions that defined my research process:

1.

How does the ability to create and share fan-driven content influence the level of engagement and satisfaction among sports fans?

2.

What impact does increased diversity of perspectives in sports broadcasting have on the inclusivity and representation of different fan groups?

Over 3 weeks I conducted:

Spprts Scope Interviews

5 Semi-Structured Interviews

Spprts Scope Interviews

5 Semi-Structured Interviews

Spprts Scope Interviews

5 Semi-Structured Interviews

Spprts Scope Creators

23 Creators Analysed

Spprts Scope Creators

23 Creators Analysed

Spprts Scope Creators

23 Creators Analysed

To gather more rich data, I conducted 5 interviews which made me discover the top 3 challenges fans currently face in sports broadcasting, Lack of Diverse and Unbiased Commentary, Identifying Bias, and Disconnection Between Broadcasters and Fan Communities. I aimed to uncover the reasons why younger audiences felt disengaged and uninterested in traditional sports broadcasting. This quote from one of the interviewees captures the sentiment perfectly:

“Traditional sports broadcasts feel repetitive and out of touch. They focus on the same teams and storylines, and the commentators don’t bring anything new or relatable. I’d rather hear raw, unfiltered reactions from other fans who actually share the same passion and aren’t afraid to speak honestly. It just feels more real and engaging than the polished, corporate stuff on TV.”

The primary research highlighted a clear gap between traditional sports broadcasting and fan expectations. While fans crave diverse, unbiased, and authentic commentary, current media fails to deliver tools that help them navigate, compare, and engage with this content effectively.

Define

Define

Define

I gathered all the information collected from the Surveys, Interviews, and Content Analysis. The Affinity mapping framework helped me reach a consensus after the user research phase (phase 1). It helped me distil and sort a large amount of data with practical insights:

Sports Scope Define (Affinity Diagram)

Key findings/insights found after analysis:

  1. Seeking Diverse Opinions

A strong desire for more varied perspectives in sports commentary. Traditional broadcasts focus heavily on mainstream teams and repetitive narratives, leaving underrepresented athletes, niche sports, and diverse cultural backgrounds overlooked

  1. Call for Unbiased and Accessible Sports Coverage

Voiced frustration with the biased nature of traditional sports media, which often prioritizes commercial interests over authentic, fan-driven narratives. Additionally, many found sports coverage to be inaccessible due to high costs and fragmented platforms, further alienating them from the sports they love.

From this, I concluded the following…

Problem Statement

Problem Statement

Problem Statement

In today’s fast-paced sports media landscape, fans often feel a mix of disconnection, frustration, and lack of representation when engaging with traditional sports broadcasts. These feelings are heightened when fans struggle to find diverse perspectives or authentic commentary that resonates with their unique interests and backgrounds. While social media offers an outlet for fan-driven content, it’s often fragmented and difficult to navigate, leaving fans overwhelmed. And even though there are more ways than ever to engage with sports, it’s still tough for many fans to feel truly connected to the broader sports narrative without a platform that integrates and amplifies their voices.

This begged the questions of

How Might We

How Might We

How Might We

  1. How might we aggregate and compare diverse fan-driven opinions to make it easier to find varied perspectives?

  2. How might we enhance sports broadcasting by integrating more fan-driven content?

Meet The Users

Meet The Users

Meet The Users

QUI

MILIND

JAS

Quianna Nguyen

QUI

“The Diverse Perspective Seeker”

21 years old

Human & Avid Tennis and F1 Enthusiast

“There’s a disconnect between broadcasting and fans... I think fan opinions should be integrated more into broadcasts.”

QUI

MILIND

JAS

Quianna Nguyen

QUI

“The Diverse Perspective Seeker”

21 years old

Human & Avid Tennis and F1 Enthusiast

“There’s a disconnect between broadcasting and fans... I think fan opinions should be integrated more into broadcasts.”

QUI

MILIND

JAS

Quianna Nguyen

QUI

“The Diverse Perspective Seeker”

21 years old

Human & Avid Tennis and F1 Enthusiast

“There’s a disconnect between broadcasting and fans... I think fan opinions should be integrated more into broadcasts.”

Thinking Process behind user selection

The thinking process behind user selection was rooted in identifying modern sports fans' core frustrations and unmet needs, through the survey the biggest group was genz. Through interviews and surveys, we focused on selecting users who not only engage with sports differently—whether through data-driven analysis, fan-generated content, or a desire for inclusive storytelling—but also those who face challenges in accessing authentic and relatable commentary. By targeting these distinct user groups, we ensured that the research addresses a broad spectrum of experiences and expectations, ultimately creating a platform that resonates with a diverse, engaged, and passionate fanbase.

User Journey Map

User Journey Map

User Journey Map

The User Journey Map illustrates the key stages sports fans go through when engaging with traditional sports broadcasting. The mapping process helps highlight the emotional, cognitive, and practical challenges faced by users, providing valuable insights for designing the platform.


A User Journey map was crafted featuring Qui, by understanding these distinct journeys, we can identify pain points in the current broadcasting experience and uncover opportunities for a personalized sports media platform.

Sports Scope User Journey Map

Develop

Develop

Develop

Given our research findings, I devised three divergent design ideas that tackled the problem space. I used two ideation techniques. The ideas followed Key focus areas including:


  1. Aggregating diverse fan-driven content to provide a more inclusive sports experience.

  2. Developing comparison tools to help users assess biases in sports commentary.

  3. Creating interactive features that foster real-time fan engagement.

Idea 1

(Aggregating all creator content)

Idea 2

(Comparing individual creators)

Idea 3

(Comparing multiple creators and

watching streams)

Sports Scope Idea 1

Idea 1

(Aggregating all creator content)

Idea 2

(Comparing individual creators)

Idea 3

(Comparing multiple creators and

watching streams)

Sports Scope Idea 1

Idea 1

(Aggregating all creator content)

Idea 2

(Comparing individual creators)

Idea 3

(Comparing multiple creators and

watching streams)

Sports Scope Idea 1

Thinking process behind ideation methods

I chose brainstorming and sketching as my primary ideation methods to focus on rapid idea generation and visual thinking, helped in exploring multiple solutions quickly. Brainstorming allowed me to generate diverse concepts without judgment, focusing on creativity and first principles thinking. Sketching complemented this process by providing a visual representation of ideas, making it easier to identify potential design challenges, refine user flows, and conducting user testing early in the process

How I decided to pursue 1 ideation result:

I was very confused as to which idea to pursue and take ahead, after a brief moment of thinking I remembered while I worked at a startup, we always used an effort vs impact matrix to make quick product decisions. Therefore, I constructed an effort vs impact matrix to evaluate each idea based on how much effort it would take to build the Low-fi MVP vs the impact/results the testing would give me. Surprisingly, Idea 3 came out on top and in an attempt to prove myself wrong and clarity, I also conducted testing with the users:

Sports Scope Idea interview

Users mentioned idea 3 was Able to compare multiple creators at once while quickly showing the reasoning behind decisions and the stream.

Prototyping

Prototyping

Prototyping

In total 5 rounds of testing were conducted as follows: 2 heuristic evaluation rounds and 3 user testing rounds (SUS, TOL, and Post interview). I followed the end-to-end prototyping process, trying to involve user in every key decision.

Sketches

Sketches

Sketches

As seen before, the sketches provided valuable insight into how users could potentially users problems could be solved and what the information architecture would look like. The sketches clearly outlined the layout and practical features of the application.

Information Architecture (Rough)

Information Architecture (Rough)

Information Architecture (Rough)

Sports Scope Information Architecture

Low-Fidelity Prototyping

Low-Fidelity Prototyping

Low-Fidelity Prototyping

As the sketches were finalised, low-fidelity prototyping was utilised to lay out the solution concepts early and for testing. However, a few iterations were made between the sketches and Low-Fi prototypes:

Sports Scope Iteration 1

Button Mis-clicked

The user mentioned the compare button was a massive eyesore and upon further prototype testing, the compare button went against the rule or hierarchy and would often be mis-clicked when navigating.


Additionally, the settings page was converted to a profile page that showcased personal viewing and bias status based on content consumed. This aligned with the goal of personalisation.

Additional Compare Homepage

One key request users bought up was the compare homepage.


Why: Having an overall view of active live events that showcase what percentage of creators of that sport and biases vs non-biased. Improves decision-making and increased task completion rate.

Sports Scope Iteration 2

MId-Fidelity Prototyping

MId-Fidelity Prototyping

MId-Fidelity Prototyping

As results slowly started coming in for testing done during the low-fi stage, I started converting them into Mid-fidelity Screens, the designs were refined to include more detail and colour, focusing on user interface elements and navigation structure. This stage helped visualise how users would interact with features like real-time fan commentary, comparison home page, and creator comparison tools. The only additional iterations at this stage was the integrations of system status, making sure the users know where they are at all times.

Sports Scope Mid-fi prototype

Changes made from Low-fi to Mid-fi:

One of the key issues users would bring up is how the biased decision is made and on what basis. Insights were requested into why the algorithm thinks the creators stand where they stand. How the overall comparison is calculated and what are the major trends amongst the creators/sport.


Between Low-fi and Mid-fi, users requested more transparency over how trends are calculated and therefore, a decision was made to implement data visualisation feature within the platform.

Testing Round 1-3

Testing Round 1-3

Testing Round 1-3

I tested the mid-fidelity design as a prototype that participants click through, following certain tasks upon instructions given to them. Overall participants performed 4 different kinds of user testing practices. In total, I conducted:

Sports Scope Peer Heuristics

2 Peer Heuristic Evaluations

Sports Scope Peer Heuristics

2 Peer Heuristic Evaluations

Sports Scope Peer Heuristics

2 Peer Heuristic Evaluations

Sports Scope Think Out Loud

4 Think Out Louds

Sports Scope Think Out Loud

4 Think Out Louds

Sports Scope Think Out Loud

4 Think Out Louds

Sports Scope System Usability Score

4 System Usability Scores

Sports Scope System Usability Score

4 System Usability Scores

Sports Scope System Usability Score

4 System Usability Scores

Sports Scope Post taks interview

4 Post Task Interviews

Sports Scope Post taks interview

4 Post Task Interviews

Sports Scope Post taks interview

4 Post Task Interviews

Some key insights:

After the test was complete, I consolidated all the information and visualised the SUS data. Here are the results and key insights:

Sports Score SUS score

Key Insights:

  • “The design is clean. However, the bias analysis section feels crowded.”


  • “So many random buttons linked back to the comparison home page.”


  • “There are no other comparing metrics other than general bias”


  • “I want to compare two specific content creators”


  • “I would love to see the bias percentage for every creator”


  • “As a new user, I have no idea what the navigation icons mean”

High-Fidelity Prototyping

High-Fidelity Prototyping

High-Fidelity Prototyping

Multiple iterations were made based on the feedback change in certain features while sticking to the problem statement. These iterations were then integrated into our high-fidelity design, following a carefully considered design system. Here are the key iterations:

Sports Scope FInal Iteration 1
Sports Scope FInal Iteration 2
Sports Scope FInal Iteration 3

Testing Round 4-5

Testing Round 4-5

Testing Round 4-5

Once the High-fidelity mockups were complete, I conducted 2 more rounds of testing to make to fix minor details I may have missed upon and to make sure I met the tasks on my usability plan.

Sports Scope Final Heuristic Evaluation

1 Peer Heuristic Evaluations

Sports Scope Final Heuristic Evaluation

1 Peer Heuristic Evaluations

Sports Scope Final Heuristic Evaluation

1 Peer Heuristic Evaluations

Sports Scope Final System Usability Score

1 System Usability Score

Sports Scope Final System Usability Score

1 System Usability Score

Sports Scope Final System Usability Score

1 System Usability Score

Usability Plan

Usability Plan

Usability Plan

Sports Score Usability Plan

Some key insights after testing:

The usability evaluation of the Sport Scope app showed strong alignment with Nielsen’s 10 Usability Heuristics, highlighting a user-centric, intuitive interface. The app excels in system visibility with clear titles and feedback, while familiar tab-based navigation mirrors popular apps for intuitive use. User control is supported with back arrows, though adding one between Home and Compare could improve navigation.


Consistency in design and colour schemes offers a seamless experience, and error prevention is strong, with no significant navigational issues. The app reduces cognitive load through familiar icons, though refining the Compare tab label could enhance clarity. It supports both novice and experienced users, and shortcuts to favourite content improve efficiency.

Final Product

Final Product

Final Product

Sport Scope

Sports Scope App Home Screen

Why settle for the usual when you can experience the game through the fans’ eyes?

Experience Sport Scope today and change the way you watch sports

Sports Scope Feature 1

Explore Sports Content

Find a live sports event and compare creators according to your preference.

Compare bias between individuals

Use AI to analyze bias between your favourite creators.

See where creators stand

View the Bias Meter to understand the app's rating and where creator’s stand.

Sports Scope Wireflow

Reflection

Reflection

Reflection

Even though I am extremely proud of the 8-week design process that got the highest mark in my cohort, after careful consideration I would change certain aspects of my design process to understand the problem further and build a better or different product. Before I get into what I would change, here are a few things I learned while building this product:

  1. Obsession over users

Even though, as designers, the first thing we are taught is the importance of listening to customers, I decided to take this a step further. For this project, I involved users in every single phase—from initial ideation to final testing. This constant engagement ensured that the product was shaped by real user needs, not assumptions. Each iteration was driven by user feedback, which helped me refine key features like the individual comparison feature.


In total, over 20 interviews and testing sessions were conducted with 6 users across the 8 weeks. This approach taught me that user insights aren’t just valuable—they are essential for creating a meaningful and effective design.

  1. Prototype over perfection

Early in the project, I realized that chasing the ‘perfect’ design from the start would slow down progress and hinder creativity. Instead, I adopted a mindset of rapid prototyping and continuous iteration. By creating low-fidelity sketches and evolving them into more detailed prototypes, I was able to test ideas quickly and gather feedback without getting attached to any single version.


This approach allowed me to fail fast and learn faster. It became clear that perfection is the result of iteration, not the starting point. Each prototype brought valuable insights that guided the next step.

What I would change:

If I were to start this project from the beginning again, I would change my research process. My primary focus would be to uncover the fundamental problem and the fundamental truth. Using first principles thinking in my research process and solution could uncover problem areas I would have never thought about. "5 Whys" would be implemented to understand root causes.

More prototypes would be made with different variations and testing would be conducted on an ongoing basis with a much more diverse audience to make sure accessibility is not an issue with any demographic.

Achievement

Achievement

Achievement

After submitting the entire project, I ended scoring the highest mark in my cohort. I achieved a 96% score on the assignment and HD for the entire project. But the biggest accomplishment/compliment i received was form the users, 2 of the participants requested an app like sports scope to be built for their day-day sports content consumption.

This was the final feedback received by my mentor/tutor:


"Everything from the introduction to the final iteration displayed a level of communication with your users – a great skill to have as a UI designer. There is a rigour in your iterations – I appreciate the clarity with which they were communicated and justified."

Thank you